Truth Table Generator with Venn Diagram Visualization
Enter up to 3 variables and a Boolean expression. See the truth table and Venn diagram highlighting the output.
Truth Table:
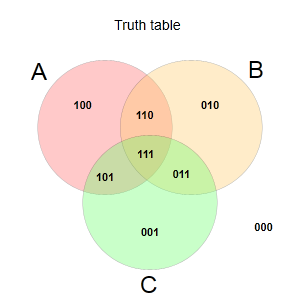
Venn Diagram Visualization:
Unlock deeper insights into logical expressions by pairing traditional truth tables with intuitive visualizations. Our Truth Table Generator with Venn Diagram Visualization at TruthTableGenerator.site allows students, educators, and professionals to seamlessly connect Boolean logic with its graphical representation. Use this logic solver to confirm if your Boolean formula works correctly.
What Makes This Tool Unique?
While typical truth-table generators (like Stanford’s) offer standard table outputs, our tool enhances comprehension by dynamically drawing Venn diagrams based on the truth table’s region outputs. This integration bridges symbolic logic and visual understanding—ideal for learners who grasp concepts better graphically.
Key Features
- Automatic Truth Table Generation
Instantly compute all possible input combinations and their results. - Dynamic Venn Diagram Visualization
Watch as each logical expression maps to colored Venn regions (2–3 sets supported). - Intersection Insights
Shade overlapping regions to represent logical operations like AND, OR, NOT, XOR, and implications—enhancing conceptual clarity. - Interactive Interface
Hover over Venn regions to view corresponding truth rows; click table entries to highlight specific areas. - Customizable Set Names & Colors
Tailor set labels, colors, and styles to match classroom needs or personal preferences. - Error Checking & Tooltips
We highlight syntax errors and provide quick-access operator guidance. - Exportable Outputs
Download both the truth table and diagram for use in reports or presentations.
How to Use It
- Enter Your Logical Expression
Use standard notation !A & (B ∨ C) or ¬A ∧ (B ∨ C). - Choose Variable Count
Select 2 or 3 variables to determine whether a 2-set or 3-set Venn is drawn. - Generate
Click “Generate” to view the truth table and instantly display the respective Venn diagram. - Analyze & Export
Explore shaded regions and table data side-by-side — then download your results with ease.
Educational & Practical Benefits
- Enhanced Learning Experience
By linking symbolic and visual representations, students gain a deeper grasp of set relationships and logic. - Great for Teaching
Facilitates classroom demonstrations of logical concepts like “A AND B” or “A implies B” using both tables and diagrams. - Helps in Boolean Reasoning
Use the visual–symbolic mix to support proofs, set theory, and logical argumentation. - Quick Export for Assignments
Build rich visual aides for slides, papers, or quizzes.
Some Related Tools
❓ FAQs — Truth Table Generator with Venn Diagram Visualization
1. What is a Truth Table Generator with Venn Diagram Visualization?
It’s an online tool that not only creates truth tables for Boolean expressions but also visualizes logical relationships through interactive Venn diagrams.
2. How does the Venn diagram help in understanding truth tables?
The Venn diagram provides a visual representation of how different logic variables overlap and interact, helping users easily understand the true and false regions in Boolean logic.
3. Can I generate both the truth table and Venn diagram together?
✅ Yes, the tool automatically displays both the truth table and corresponding Venn diagram, making it perfect for learning logic concepts step by step.
4. What kind of expressions can this tool handle?
It supports Boolean expressions, logical operators (AND, OR, NOT, XOR), and can visualize 2-variable, 3-variable, or even 4-variable logic relationships.
5. Who should use the Truth Table Generator with Venn Diagram Visualization?
It’s ideal for students, teachers, and logic learners who want to see how truth values translate into visual regions, improving understanding of Boolean algebra and set theory.
Conclusion
The Truth Table Generator with Venn Diagram Visualization blends analytical rigor with visual intuition. By turning logical expressions into both tables and diagrams, it enhances comprehension, aids teaching, and enriches digital workflows. Try it now—and visually validate your logic in a whole new way!